News

Pedography for the Diabetic Foot
Pedography as a diagnostic tool for early recognition of altered pressure patterns in the individual with diabetes.
In the early 1980’s, studies were first published looking at the changes in dynamic pressure distribution patterns of persons with diabetes. Inspired by studies conducted in England with the Pedobarograph, the first electronic pressure distribution measuring system, Kirsch, Schaff, and Seitz made their initial tests in Germany (1983) to examine the pressure distribution changes in neuropathic feet with a new measurement technology.Their new measurement system, known as emed and developed by Novel, was used in these studies. For the first time, more precise data could be provided with the emed capacitive sensor technology. The neuropathic foot tests clearly showed a difference when compared to healthy feet.
In 1984 the Bundesministerium fuer Forschung und Technologie (State Department for Research and Technology) sponsored a project led by Professor Mehnert and conducted by Dr. Dieter Kirsch from the Munich Diabetes Research Group. The Research Group examined more than 600 persons. The diabetics with neuropathy could easily be identified from their specific foot pressure patterns during dynamic loading.
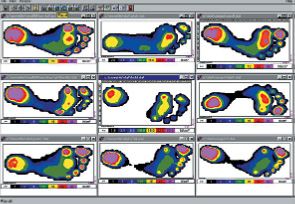
Pressure picture of non-neuropathic foot
Pressure picture of neuropathic foot
It was documented that during the roll-over process, the neuropathic forefoot displayed increased and longer loadings than the healthy forefoot. The neuropathic patients also exhibited a "slap" gait. The load on the heel and toes was lower the areas of highest risk for tissue breakdown. Consequently, it was suggested that a relationship between the absolute pressure and the risk for tissue breakdown could be established. Currently there is no associated localized pressure threshold, which guarantees tissue breakdown. However, in recent studies it is noted that 50 to 60 N/cm2, measured on a calibrated emed platform can suggest a risk threshold.
The recorded localized maximum pressure is dependent upon the sensor resolution and the precision in calibration of the sensors. Therefore, results from other research studies using pressure distribution technology, can only be directly compared if each sensor is carefully calibrated. A review of the pressure picture gives the following basic information: The entire display of the maximum pressure picture allows for comparisons of foot regions. It may be necessary to consider the duration of contact in addition to the absolute pressures.
The typical pressure pictures of neuropathic feet show three factors:
1. No definite roll-over process from heel to midfoot to forefoot and finally to the toes. The foot is typically in a foot flat position at ground contact and is characterized by immediate forefoot loading. This pattern can also be recognised from the center of pressure line in the foot pressure picture
2. The localized pressure values under the 3rd, 4th, 5th metatarsal heads are often elevated in relation to other foot regions. Pressure of 50 N/cm2 may be seen with the emed platform and in some cases over 100 N/cm2 is recorded.
3. The toes may be less pronounced or not visible in the dynamic picture due to diminished function.
The Charcot foot displays higher pressures in the midfoot region as compared to the typical diabetic foot pattern. Pedography may aid early detection of deformed feet and malfunction. Naturally, the pressure picture of the neuropathic diabetic patient can be influenced by foot deformities and incorrect foot function. In any case, the specific foot regions with higher pressures indicate greater risk for tissue breakdown. In addition to the standard therapy for diabetic patients, an altered load on the foot with localized high pressures may require immediate foot treatment with appropriate footwear and pressure relieving orthotics.
Under no circumstances should these individuals walk barefoot because plantar pressures will increase dramatically and the foot is left unprotected. Shoes and orthotics should be fabricated by a trained professional. The 1:1 hardcopy of the pedography platform measurement provides a baseline for the construction of the shoe insert. The patient can then be measured inside the modified shoe for quantification of the load.
In-shoe pressure distribution measurement systems were designed for that purpose. The pedar system permits measurement of the area between the plantar surface of the foot and the shoe insert. With the pedar system the patient can move freely, untethered from a computer in a natural environment under real life conditions. The goal for the diabetic patient shoe insert is to create a uniform pressure to prevent localized high pressures. The patient should be instructed to examine their feet on a regular basis.
During the patient visit, the color display and printout may be used to educate the individual about the areas of concern. Pedography is a quick measurement tool and it does not place any burden on the individual’s feet.This is precisely why pressure assessment is so valuable. The objective for health professionals is to reduce ulceration and amputation in the diabetic population. Pedography is a cost effective method to help reach this goal.